Producing Publication Quality PDFs of NMR Spectra Using TopSpin 4.0
A separate version of this information is available for TopSpin 3.5 and 3.6
PDF files of NMR spectra can be produced using Bruker's TopSpin that look more professional and more clearly represent important information than other methods such as scanning printed spectra. It is possible to add structures and labels to the spectra to clearly identify compounds.
TopSpin is now available for free for academic users on Linux, Windows, and Mac OS X.
https://www.bruker.com/service/support-upgrades/software-downloads/nmr/free-topspin-processing/free-topspin-download.html
The system used for testing was TopSpin 4.0.4 on Linux (Fedora Core 28 KDE Spin). The behavior is essentially identical on all operating systems.
Basic NMR Processing:
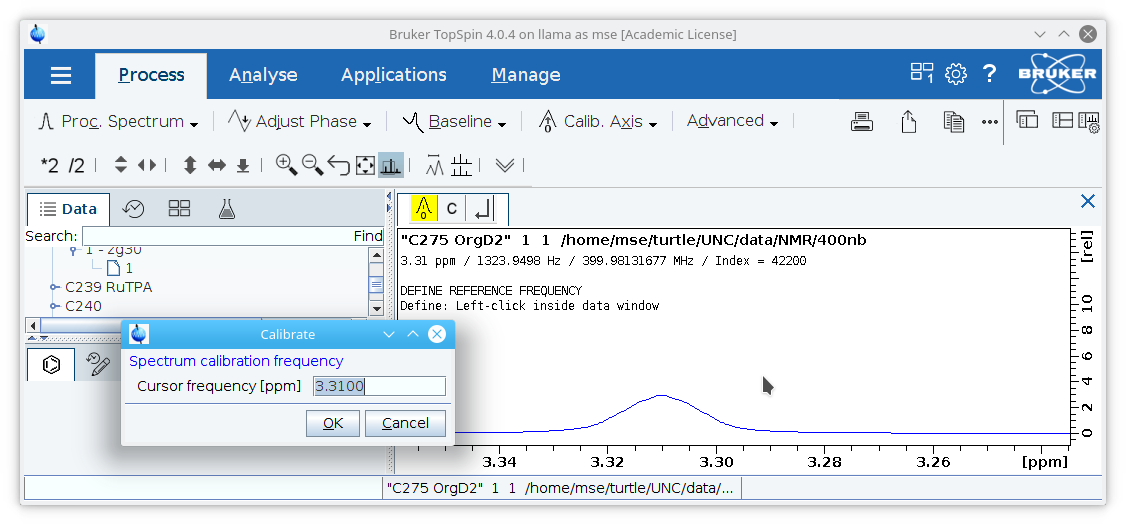
1. The chemical shift range should be calibrated to solvent residual signal (or TMS, if present) and use the value listed in Organometallics 2010, 29, 2176-2179.
Zoom in on the solvent residual peak, click the
Processtab, click the
Calib. Axisbutton, select the center of the solvent residual peak, and type in the appropriate value (7.26 PPM for CDCl3, or 3.31 PPM for CD3OD as in the example shown).
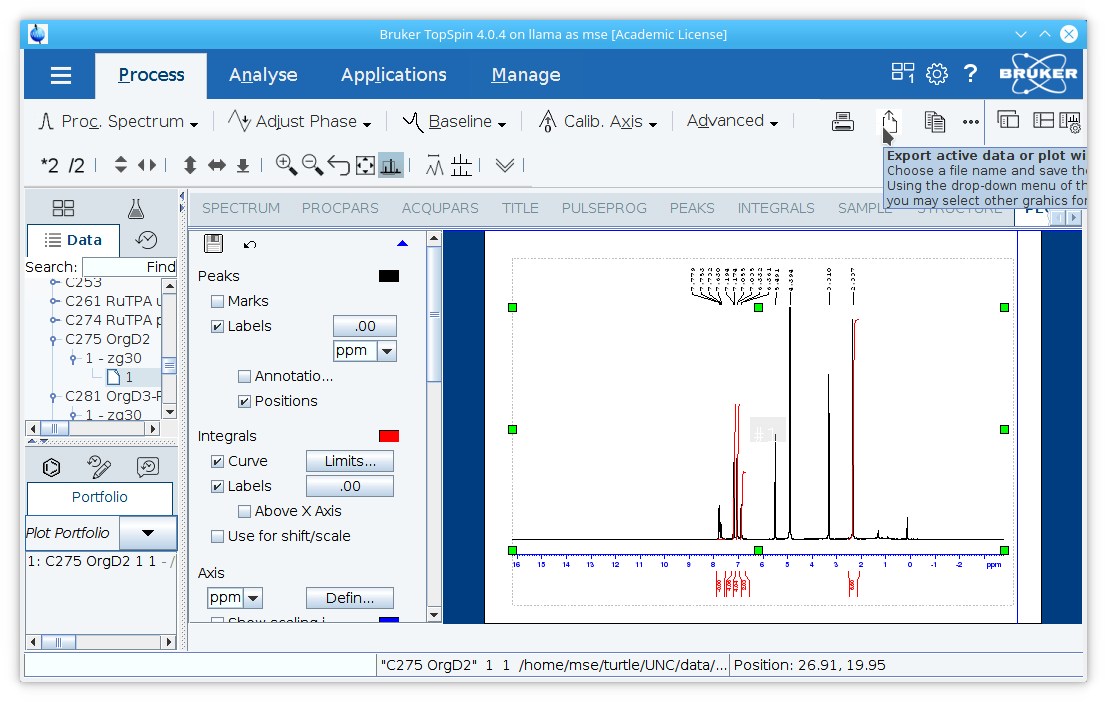
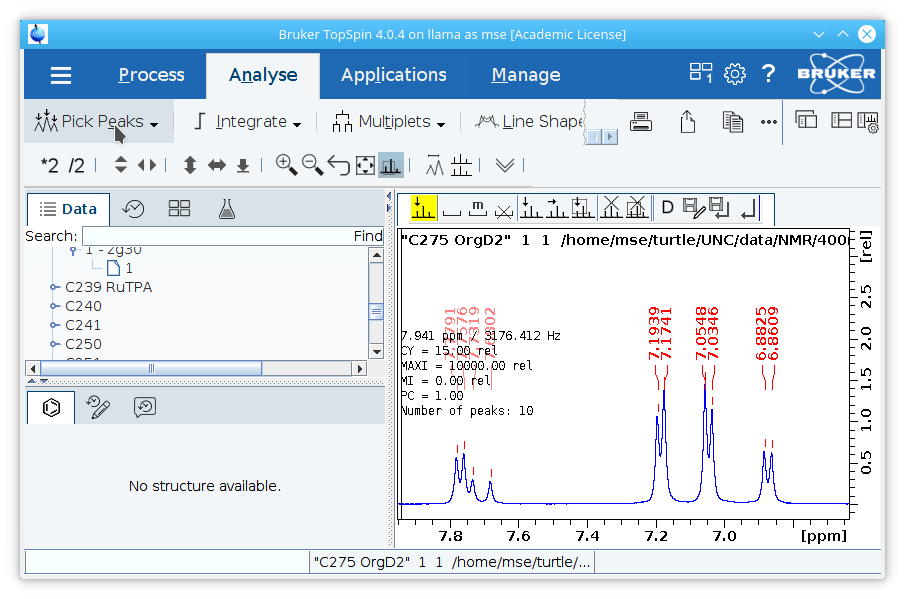
2. Use the peak picking tool to select peaks in the NMR spectrum. For each peak, there should only be as many values shown as the multiplicity of the peak. A quartet should show four values that can be used to calculate the coupling constant, a triplet three, and so on. Significant impurities and the solvent residual peak can optionally be selected, but small impurities close to the baseline should not be selected.
Click the
Pick Peaksbutton under the
Analysetab to select peaks.
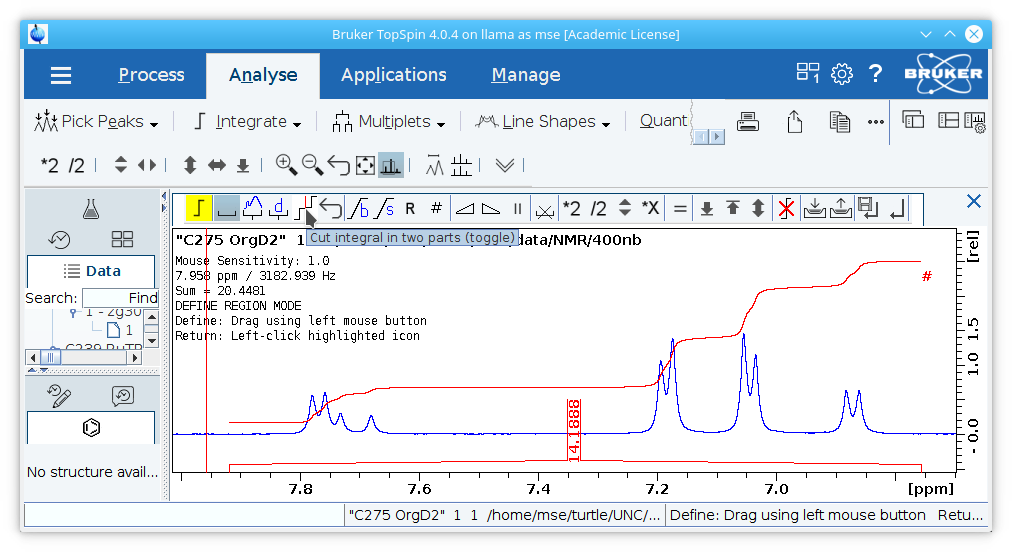
3. (Optional) Integrate peaks in the spectrum. If peaks are integrated, the bias and slope must be correctly set to achieve accurate integration. This is best accomplished by ensuring that the beginning and end of the integral are flat in an area of clean baseline. In the example shown, the peaks from ~7.65 to ~7.8 are integrated together (although they belong to two sets of protons) because they partially overlap and a significant amount of baseline is included. Including extra baseline is helpful to verify that the bias and slope are set correctly, excess baseline will not contribute to the integral as long as the bias and slope values are correct in the absence of impurities or overlapping peaks.
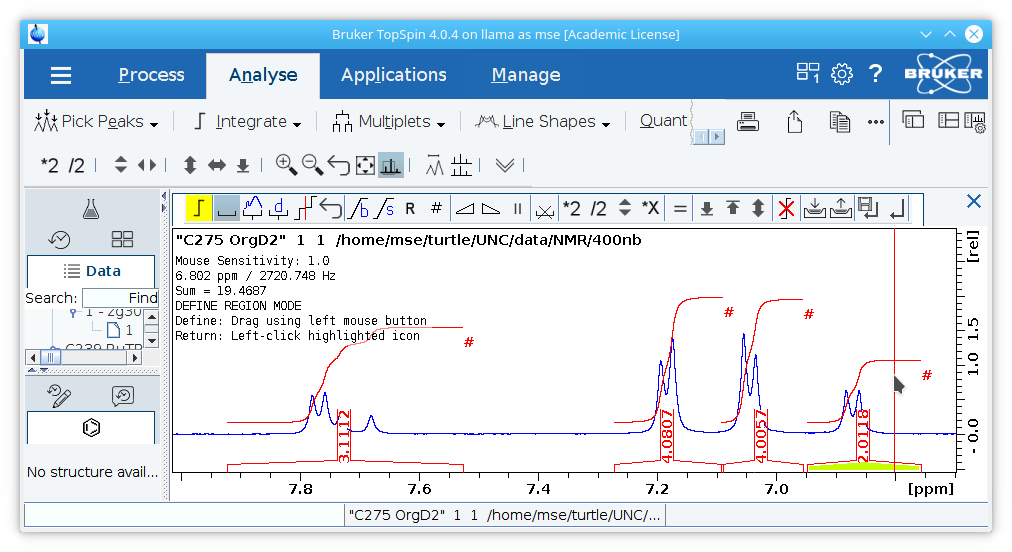
In the absence of a clean baseline near the peak of interest, a larger integral can be drawn to where there is clean baseline and cut using the
cut integral toolto be certain the slope and bias are correct.
Produce High Quality PDFs of the Spectra
4. An appropriate spectral window should be selected. Use 0-10 PPM for 1H NMR and 0-200 PPM for 13C NMR. In cases where peaks fall outside this range such as many transition metal hydrides, a larger window may be necessary and a break in the axis may be reasonable. It is easier to pre-select this window before continuing to step 5.
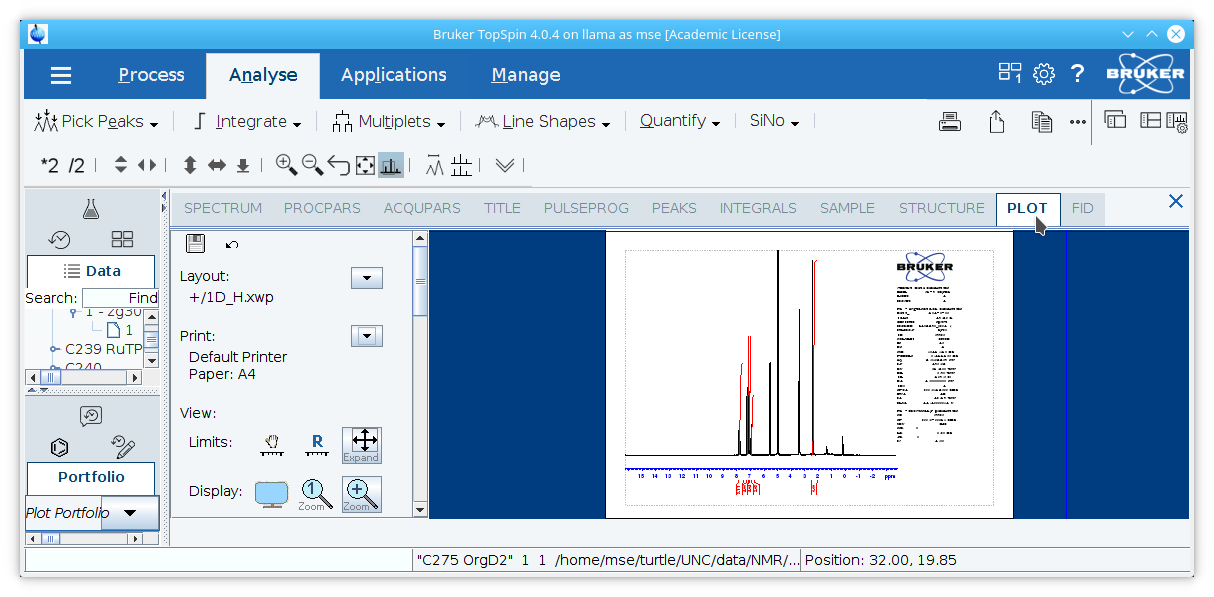
5. Select the
Analysetab and click the
Plotbutton.
6. Delete the Bruker symbol and the table
Current Data Parametersif desired.
7. Select the appropriate page size by clicking the arrow to the right of
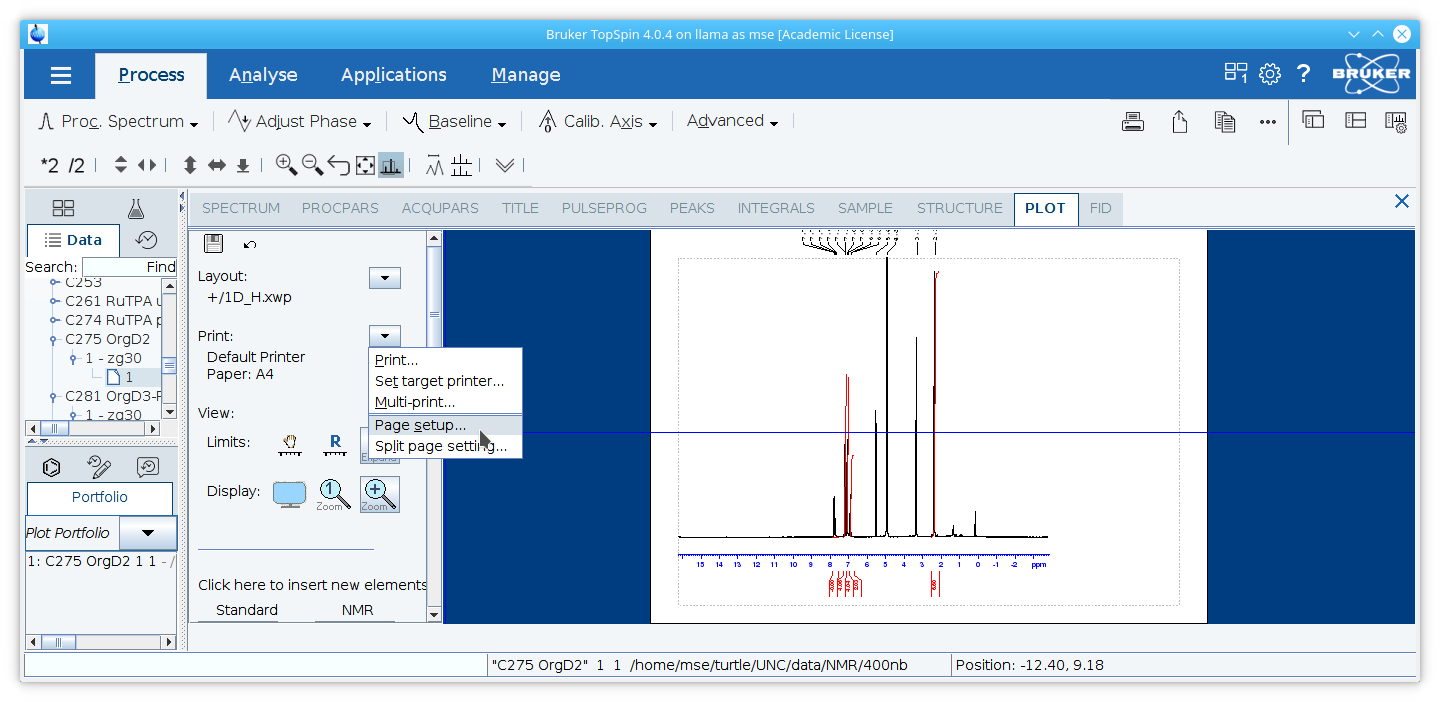
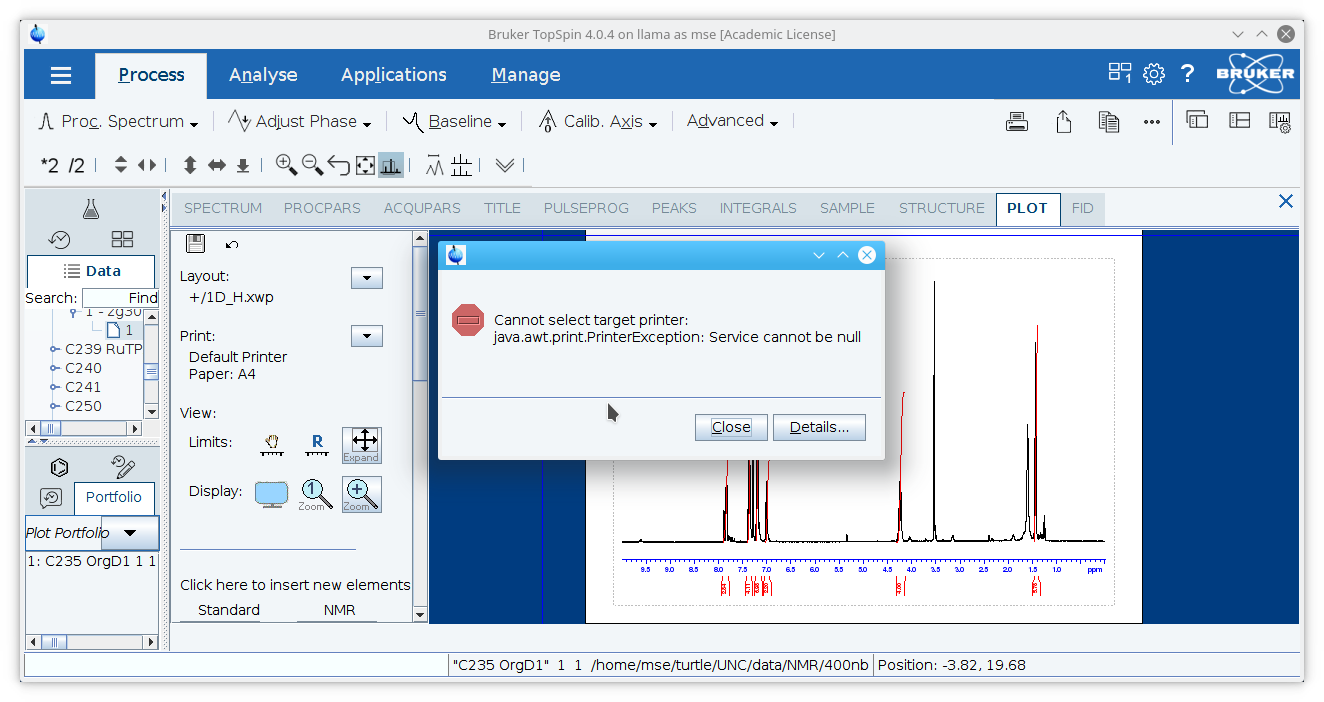
Note: if an error message appears, you may need to make a selection for the printer first even though this will not be printed. Click the arrow next to
Set Target Printer...under the sub-menu.
Select the spectrum in the plot layout window. Check the box for
Labelsunder
Peaks.
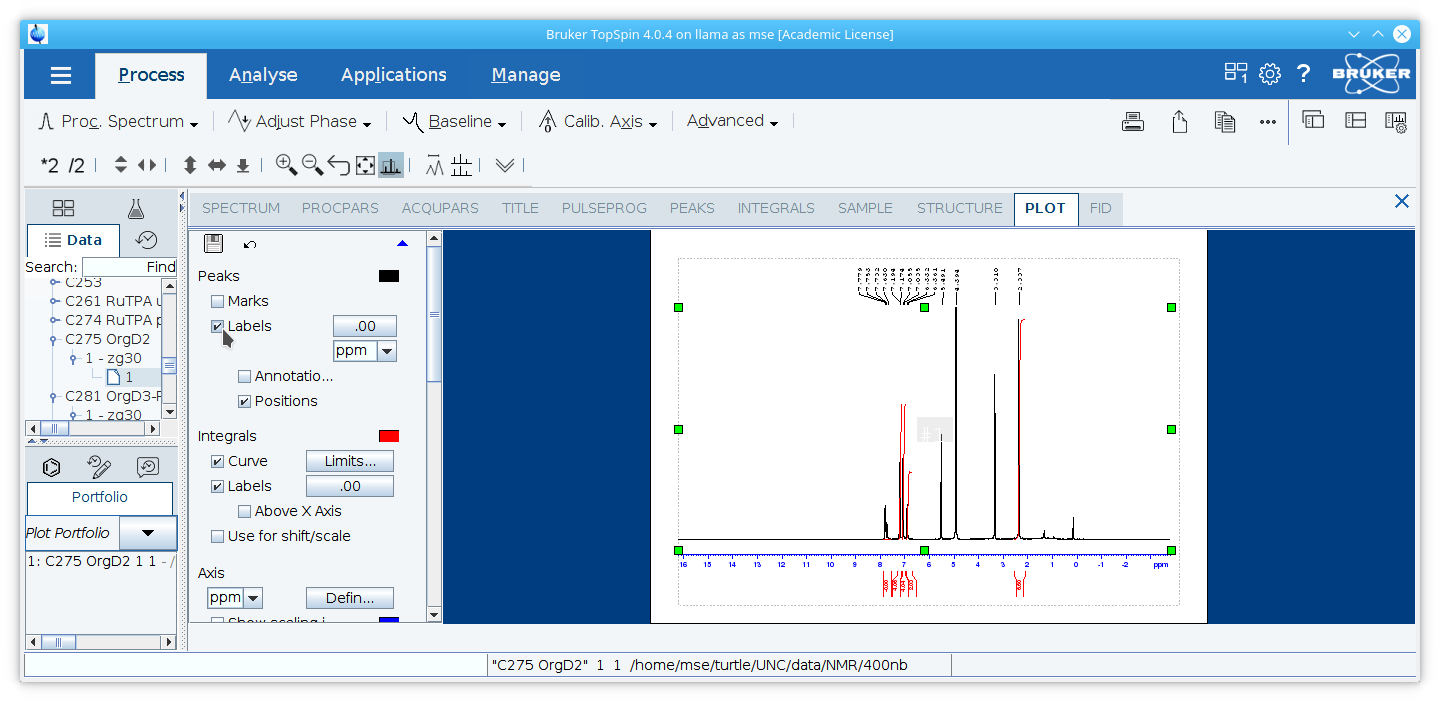
9. Resize the spectrum so the red dotted line around the spectrum aligns with the gray dotted line representing the printable area of the page.
10. Click